Study Area
The Urban Park "Pineta Castel Fusano" is a protected area established in 1980 by "Regione Lazio". Historically, the pinewood covers an area of 916 hectares and is located five miles southeast of the mouth of the Tiber. It is the largest green area of Rome. Since 1996, the Castel Fusano Pinewood Nature Reserve forms part of the Roman coast. The area of pine forest is located on the side of Ostia which, according to Virgil, fates led Aeneas.The Urban Park area in Roman times it was crossed by the connections between Rome and the sea, with the ancient Via Severiana wanted in 198 AD Emperor Septimius Severus. Since 1987 was also set up the Roman Coast Nature Reserve and the Ministerial Decree of 29 March 1996 establishing the Reserve itself merged with areas of archaeological, environmental and agricultural town of Fiumicino and Rome, including the Urban Park Pinewood Castel Fusano. The management plan of the City Park Castel Fusano had to be approved within six months after the park. The pine forest is often affected by the action of arson or fire source unidentified. Hundreds of outbreaks of fires in recent years have devastated Reserve.
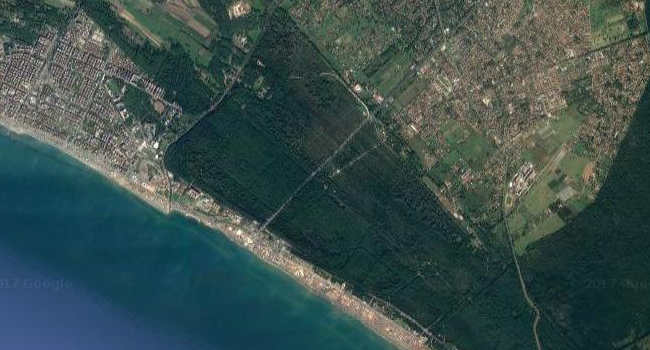
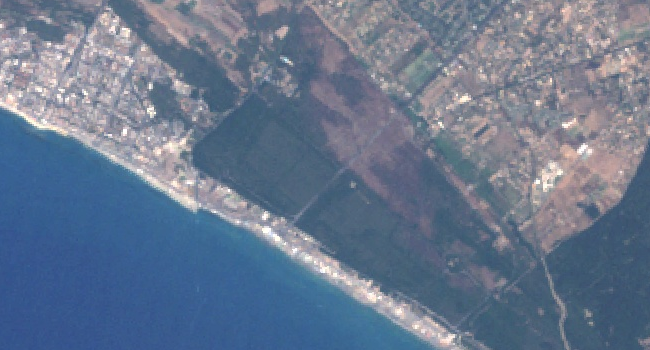
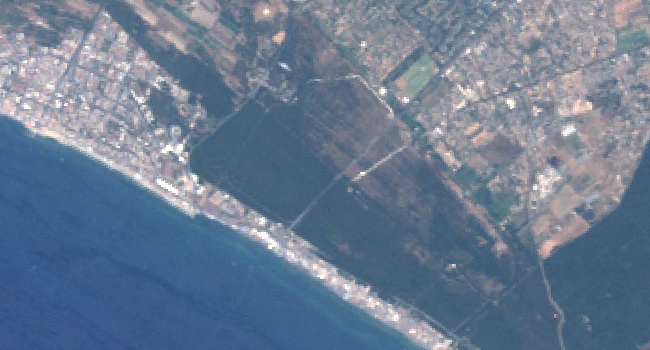
The vegetation of the pine forest, very lush, despite the proximity of the sea, is a set of tall trees (pines, oaks and make). And this one composed of juniper berries, strawberry trees, mastic trees, holly, privet, hawthorn and myrtle and other aromatic essences, which have made their nests and dens several animals: woodpeckers, blackbirds, doves, owls, owls and herons, but also sea urchins, turtles, lizards, foxes, wild boars, martens and weasels, some of whom came from the estate of Castel Porziano, owned by the Presidency of the Republic. On July 4, 2000, 300-350 hectares of pine forest and evergreen Mediterranean were hit by fire, of which 280 hectares were completely destroyed. The following three images depict the situation one year after the wild fire (July 2001) with the burnt area very visible and then two different images from Landsat 5 and Landsat 8 (July 2010 and 2016) with where some signs of recovery starts to appear.
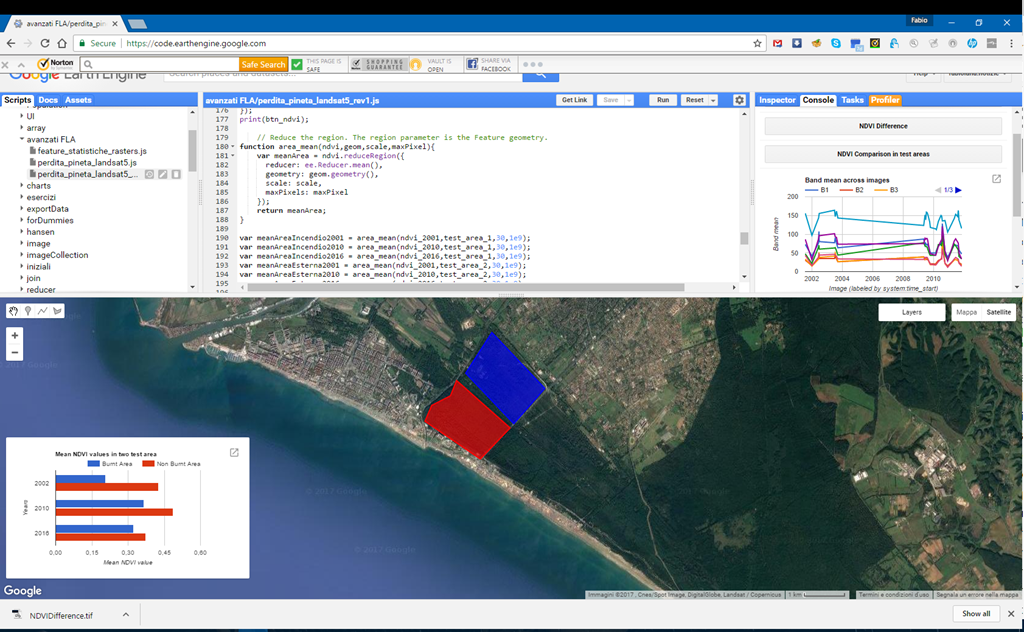
All the images have been retried using Google Earth Engine which is a a platform that enables you to analyze petabytes of satellite images on Google’s server infrastructure. In the following part I will explain the script that we wrote to calculate the data and to create the image of the colored map. I used the web-based code editor for this project. In the beginning I struggled a bit with using only Earth Engine objects. These objects get handled on the server. All calculations you do in your scripts should happen on the server and not on the client. There are satellite images from Landsat or Sentinel but also geophysical, climate or demographic data sets you can work with. We decided to work with Landsat imagery because it provides images from a period of more than 30 years and the resolution with 30x30m was enough for our use case. The images we used in our application were shot between 2005 and 2015.
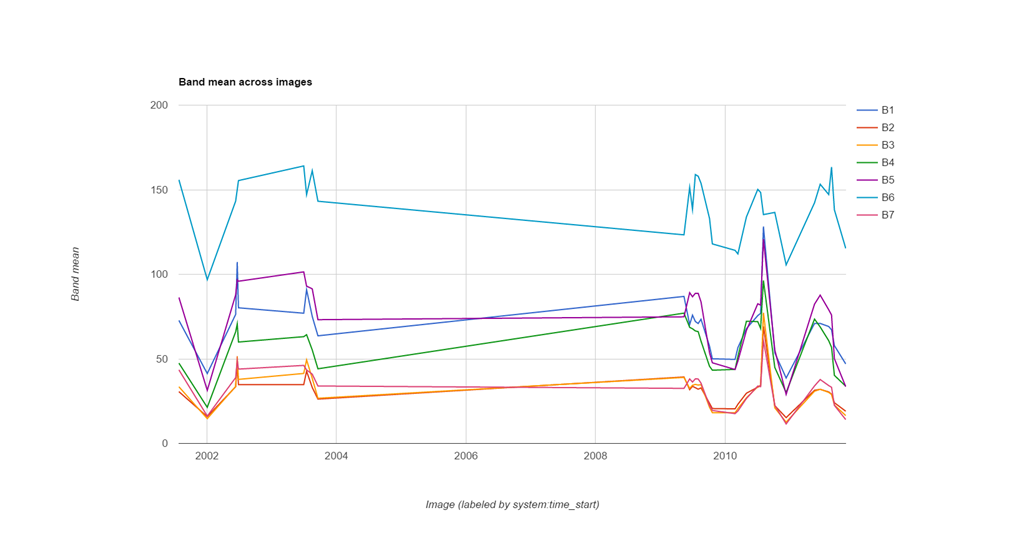
It seems that between 2004 and 2009 there are no images with the required characteristics (flat line in the above chart showing the median value for the seven bands of the Landsat 5 satellite image.
We created a
FeatureCollection as a kind of lookup for the Landsat ImageCollections we wanted to use for our calculations: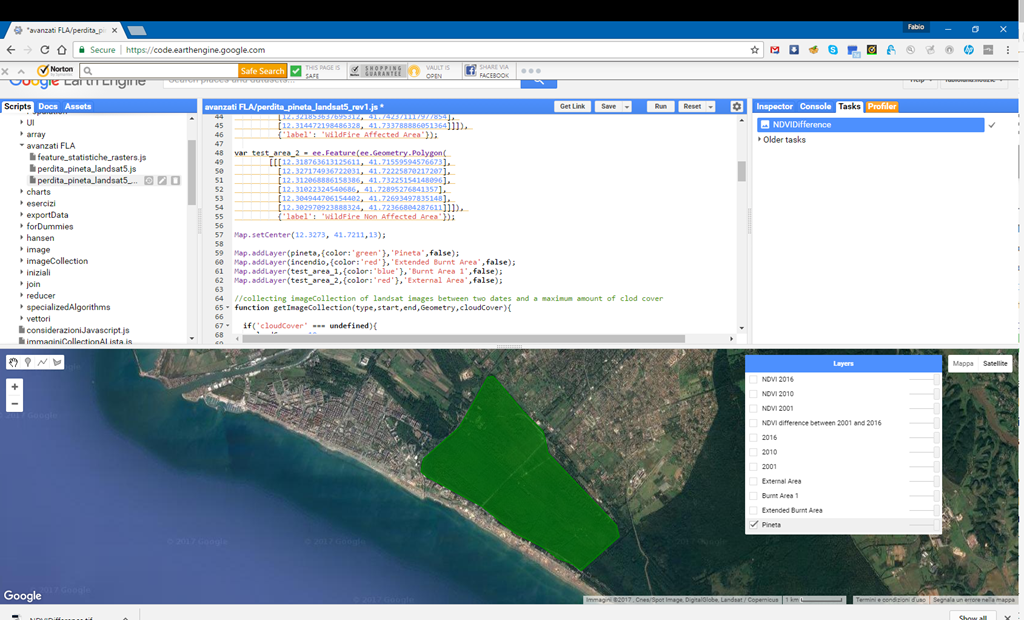
For our analysis we had to create an image collection that only contains the images we could really use in our application. We had to filter the different Landsat collections by:
- bounds - Only the area of Castel Fusano reserve (green polygon above)
- time range - Only the vegetation-rich months june and july of the years 2001, 2010 and 2015
- cloud cover - Only images with less than 10% clouds
ImageCollection object has functions like filterBounds, filterDate or filterMetadata to do this: 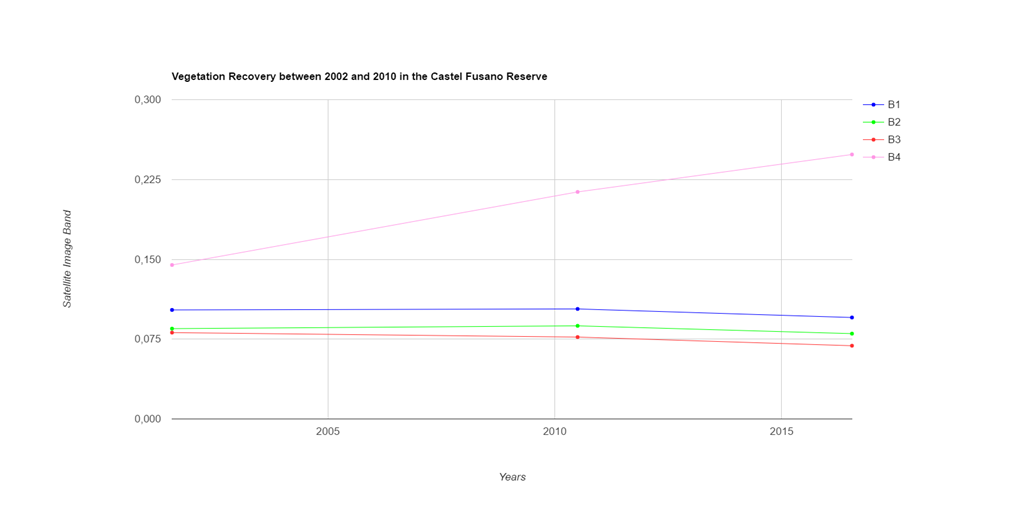
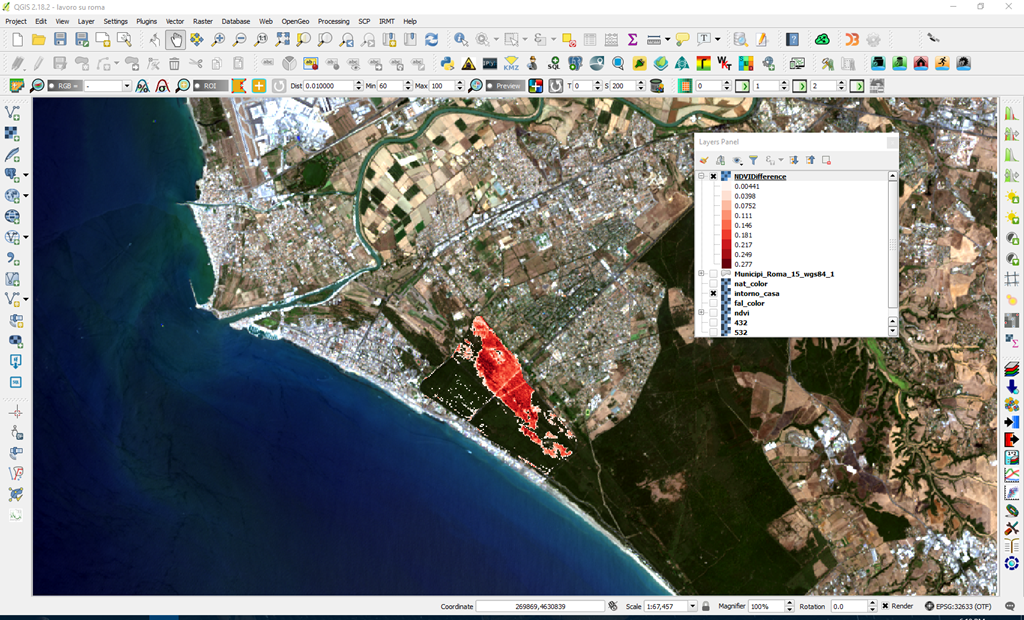
In order to compare how the vegetation is recovering I have studied two test areas one heavily affected by the fire and the other practically untouched (blue and red areas below).
 "Lorem ipsum dolor sit amet, consectetur adipiscing elit, sed do eiusmod tempor incididunt ut labore et dolore magna aliqua. Ut enim ad minim veniam, quis nostrud exercitation ullamco laboris nisi ut aliquip ex ea commodo consequat. Duis aute irure dolor in reprehenderit in voluptate velit esse cillum dolore eu fugiat nulla pariatur. Excepteur sint occaecat cupidatat non proident, sunt in culpa qui officia deserunt mollit anim id est laborum."
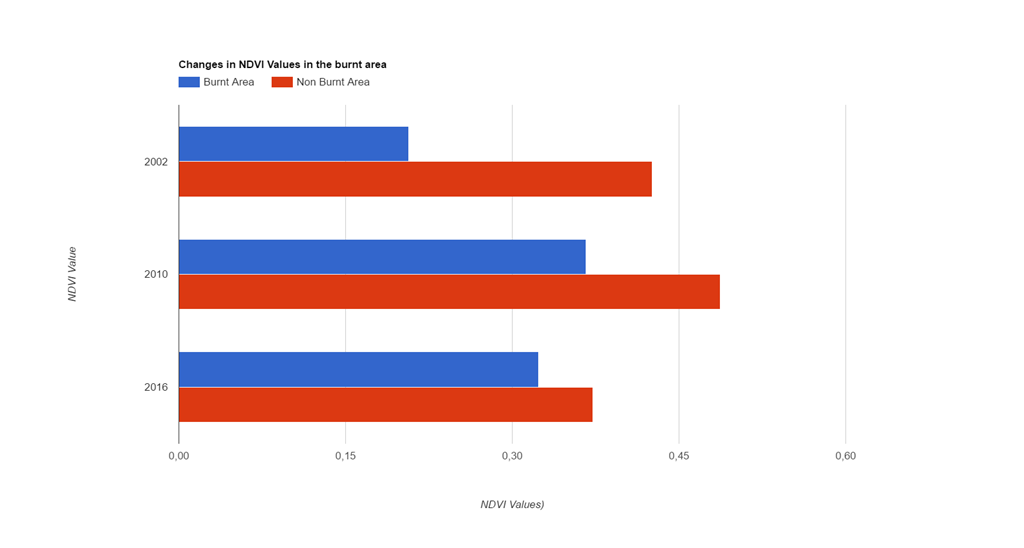
The results of the reducer have been used to generate a chart showing the difference of burnt and healthy vegetation for 2001,2010 and 2016 and is immediately evident that since 2001 the difference of the mean NDVI values has been constantly reducing and was “reasonably” comparable in 2016.
After this operation we have a NDVI value for every pixel in our image. We can now count the pixels inside the city borders and then calculate the amount of vegetation. We took a NDVI threshold of 0.45, so every pixel that has a NDVI which is equal or greater that 0.45 has vegetation and everything below doesn’t.