SPARC
Spatial Risk Calendar - World Food Programme
The WFP Emergency Preparedness Branch (OSEP), in collaboration with other relevant units, is developing a Spatial Risk Calendar (SPARC) to support emergency preparedness and programme planning. To support emergency preparedness and early warning SPARC will combine data layers covering hazard exposure and population vulnerability to determine baseline probabilistic levels of humanitarian impact associated with particular hazard types, on a monthly basis, at a sub-national level, around the globe. To support programme design it will identify subnational areas with varying degrees of exposure to natural shocks, and population vulnerability, on a monthly/seasonal level. SpaRC is a Spatial Risk Calendar that combines data layers covering hazard exposure and population vulnerability. This determines baseline probabilistic levels of humanitarian impact associated with specifichazard types. SpaRC shows this baseline information about natural hazard impacts on a monthly basis, at a sub-national level, for the entire world. Analysis results could be used to inform risk identification for early warning, emergency preparedness and readiness activities at country level and improved impact assessment for emergency response
People at risk By Country
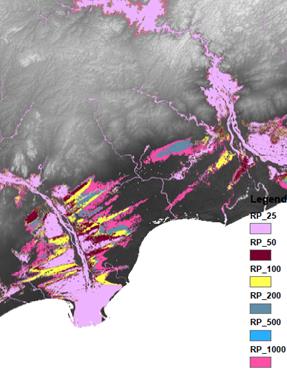
RP 25 years
RP 50 years
RP 100 years
RP 200 years
RP 500 years
RP 1000 years
The general methodology for quantitative risk is based on following equation:
RS = PT * PL * V * A
PL spatial probability of occurrence of a specific hazard scenario with a given return period in an area affecting the elements-at-risk
V physical vulnerability, specified as the degree of damage to a specific element-at-risk Es given the local intensity caused due to the occurrence of hazard scenario Hs
A quantification (value) of the specific type of element at risk evaluated. If the value is expressed in monetary terms, the risk may also be expressed as potential damage.
Hazard data:
- GAR15 global floodplain data (UNISDR)
- population data (WorldPop)
- global precipitation data (WorldClim)
- administrative boundaries (FAO GAUL)
- analysis of historical events (EM-DAT)
Vulnerability data:
- land degradation
- Food Consumption Score (FCS) commonly used as a proxy indicator for access to food
- Coping Strategies Index (CSI) is an indicator of household food security.
Annual flood hazard and people at risk
A hazard is a potentially damaging physical event, which has a probability of occurrence within a specified return period (temporal component) and within as
- Spatial probability: probability of a hazard event with a certain intensity happening at a particular location (flood extent as a result of hydraulic modelling)
- Temporal probability: probability that an event with a certain intensity happens within a given period (return period for each flood extent map as a result of hydraulic modelling)
- Magnitude probability: probability that an event happening has a certain magnitude/intensity (flood depth as a result of hydraulic modelling)
Spatial distribution of the hazard (where it could strike), characterised by its severity and frequency of occurrence (how often and how intense) is individuated it can then be used to assess the people exposed to the risk of flooding (number of people at risk).
After an initial version using the flood frequency provided by UNEP/GRID-Europe PREVIEW 2013 flood dataset, a new set of data in raster format (referred as GAR15) has being used.This dataset provides information on the flood extent and depth for six return periods, namely 25, 50, 100, and 200, 500 and 1000 years. Therefore, the flood areas extents will have the following annual probabilities of occurrence:
- Return period 25 years correspond to 4%
- Return period 50 years correspond to 2%
- Return period 100 years correspond to 1%
- Return period 200 years correspond to 0.5%
- Return period 500 years correspond to 0.2%
- Return period 1000 years correspond to 0.1%
Due to the global nature of the GAR project, flood maps do not take into account flood defenses that are normally present to preserve the value exposed to floods. This can strongly influence the results of the risk calculations and especially of the economic parameters especially at provincial level.

Monthly disaggregation of people at risk of flooding
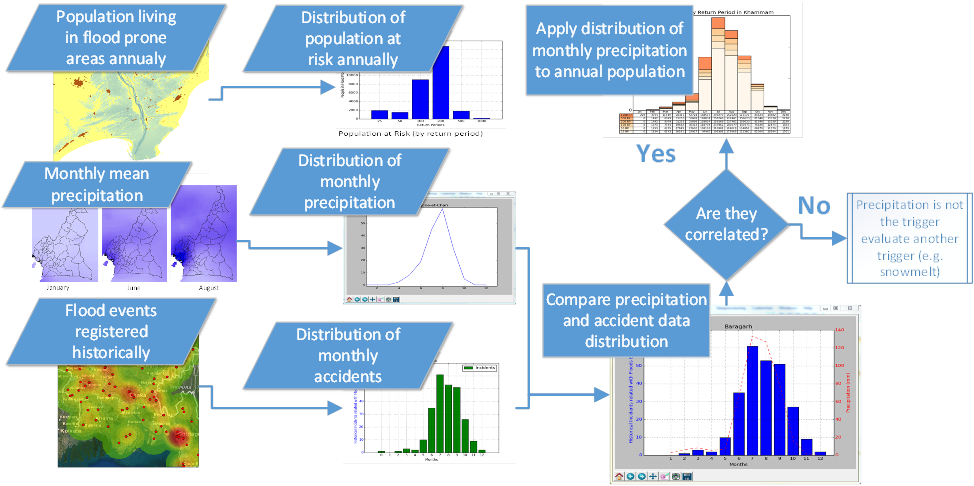
Floods are usually caused by heavy or prolonged rainfall but can also occur due to landslides triggered by heavy rainfall or earthquakes, failure of dams or hydraulic structures, or high sea levels at river mouths. Here is assumed that the source (precursor event) is rainfall and higher levels of precipitation are very likely to lead to high river discharge and consequently to flood events. This approach, sometimes referred as “correlation with triggers”, has been successfully applied in landslide hazard analysis and is based on the assumption that the frequency of the landslides (or flood) is that of the triggering event.
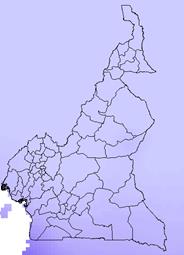
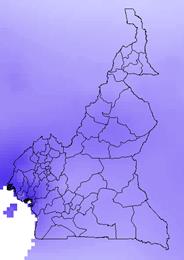
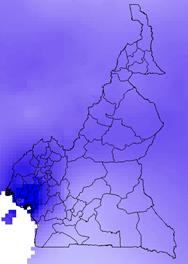
This method, applied to floods, has a few drawbacks (e.g. different triggers can cause an event for example rainfall or snowmelt) yet seems a viable solution for establishing a simple procedure capable of disaggregating the annual probability into a monthly one. In this early phase, however an attempt will be made to consider not only precipitation by adding additional factors (e.g. evapotranspiration) to build a more realistic scenario able perhaps to provide a more reliable short-term monthly estimates of flood occurrences likelihood.For this purpose, several raster datasets were used, amongst those available at FAO geonetwork, for analysing different aspects of the flood phenomena according to the equation above.The precipitation dataset chosen is a grid with estimated precipitation per month with a spatial resolution of 10 arc minutes. This dataset has been constructed from 27 075 stations with 1961-1990 climatological normals. The dataset consists of 12 ASCII-grids with mean monthly data in mm/day * 10, and one ASCII-grid with yearly data in mm/year. In addition, 12 ASCII-grid with monthly values at 5 arc minutes resolution are made available as input data for a global water balance model (GlobWat).The following image depict three different raster containing information on precipitation in January, June and August in Cameroon.
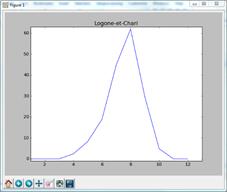
Using the whole set of twelve raster, the annual distribution of rain is calculated for each province worldwide (province are black lines in the previous image) calculating the mean millimetres registered between 1961 and 1990 in order to generate the distribution of rain in that administrative level as visible in the following pictures.
First column represents months, the second the millimetres of rain
normalize between 0 and 1 and the number of accidents also normalized to make
the comparison easier with precipitation values.
Evaporation is known to be the least of these quantities, particularly over
short periods of time, but is the only data available together with
precipitation on a monthly basis whereas infiltration and interception were
assessed only partially as they should be derived from soil data and could
easily require a study per se. Finally, the historical variability of precipitation has been used to see if
all months are equally affected by high level of variability in terms of
precipitation. Al the meteorological data have been compared with the
historical occurrences related with flood, in order to evaluate any noticeable
correlation.The result is visible in the next figure.
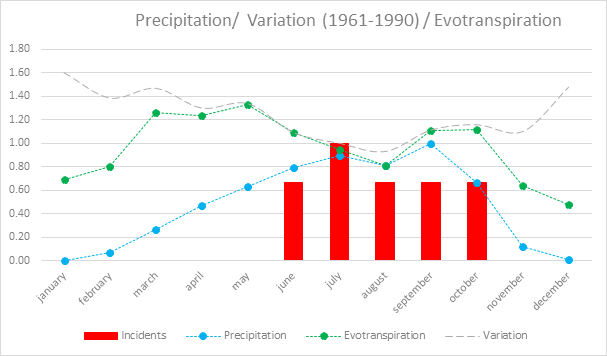
As expected, the monthly precipitation presents a strong
correlation with historical accidents and substantiate the choice to link the
number of people affected month-by-month with the precipitation
pattern. Evapotranspiration on the other hand, although showing a similar trend
risk is not adding any significant improvement to the calculation using the rain
pattern.The variation of precipitation is probably also quite interesting
showing that in months with more intense rainfall are also those with greater
stability in the amount of precipitation, which instead is very high in the
months with little precipitation.
This factor seems to be perfectly reasonable because, if there is little rain, a single heavy rain increases
the spread between minimum and maximum values and therefore the variability. On the
other hand we are comforted to know that the greatest error of estimate, in
terms of population at risk, are to be expected to be found in months with
minimal amount of precipitation and therefore with a lower level of risk.
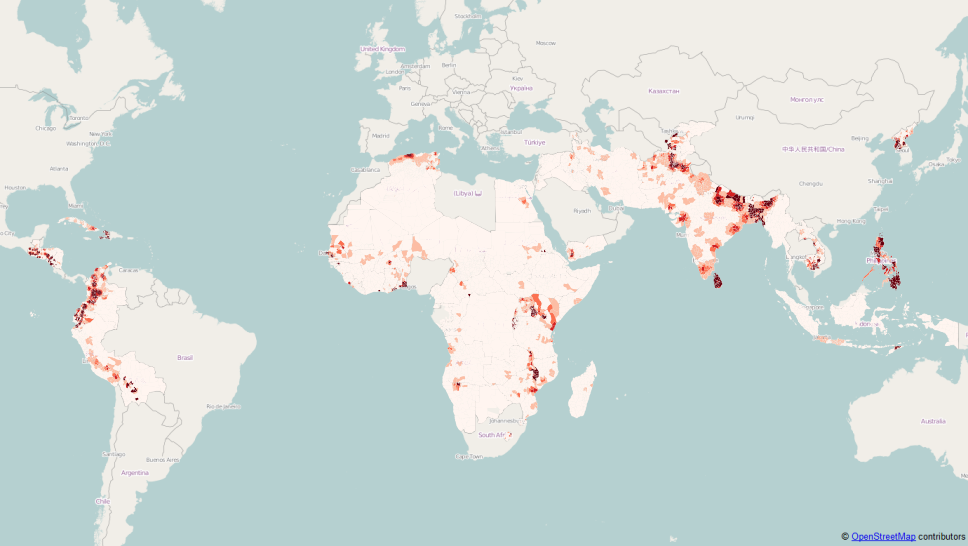
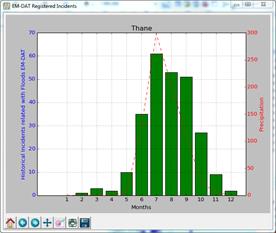
The next image shows the level of correlation calculated in a province in India
Some images show an almost perfect positive correlation (+1) with some months with the
highest values both for millimetres of rain and number of accidents
The
number of people possibly affected by month have been therefore estimated
multiplying the monthly historical distribution of precipitations, normalized in
order to derive percentages of probability, and the number of people affected by
flood for each returning period
|
|
|
In the image above, on the left, is shown a plot of rain versus accidents in
Cameroon whilst, on the right, is possible to see how well the distributions of
the rain is much more in accordance with the peak of accidents registered in
July, the rainiest month in that part of India.
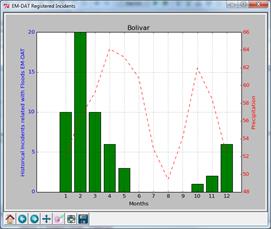
Of course, not all provinces have such a strong level of correlation. In the
image on the right as in the case of the administrative area of Bolivar in
Peru. Is possible to see that both incidents and precipitation have a bimodal
distribution and the minimum precipitation registered in August reflects in
the absence of accidents in the same month though the peak is slightly shifted
by a month or so.
Applying this methodology on several administrative areas, chosen in
different climatic zones (such as tropical, arid, temperate), it can be stated
that the correlation is very strong in urban areas and in countries where the
accidents have been regularly and systematically collected.
On the other
hand, in areas where little or no data are available the monthly risk could lead
to misleading calculation and instead of being applied directly would require
additional thinking and further data collection.
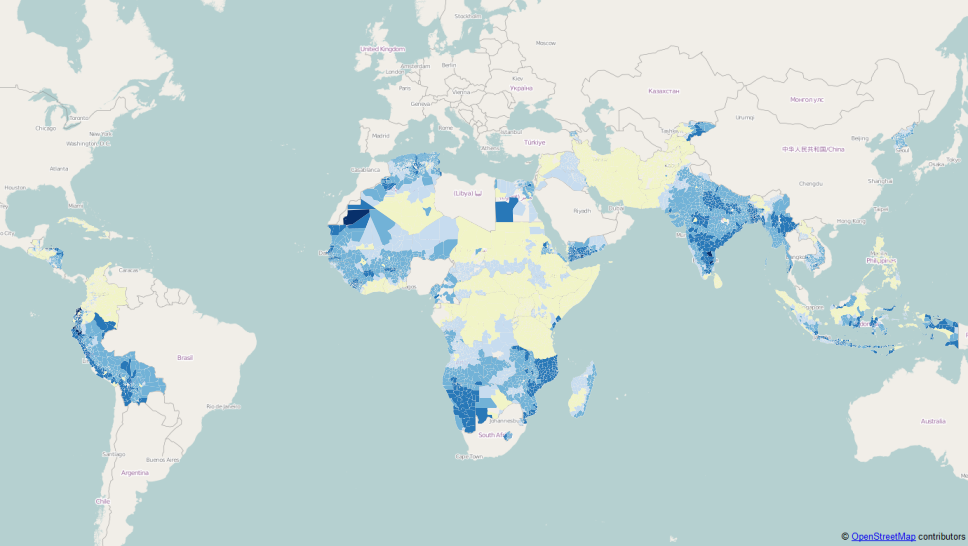
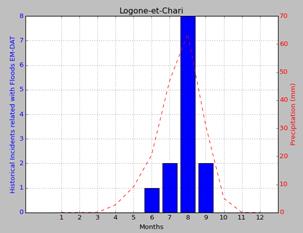
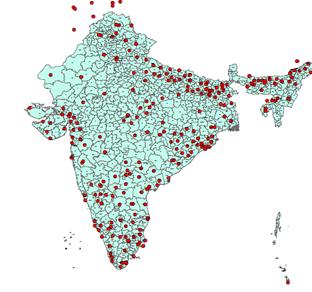
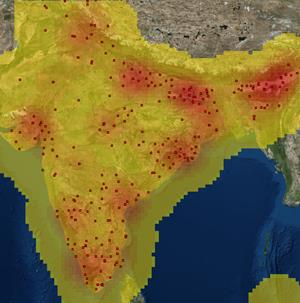
For this reason, an index has been calculated for every province as to provide a measure of the
reliability of the figures calculated in terms of population at risk. In the image below, the monthly
subdivision of people at risk can be estimated to be reasonably true for areas with many events
registered.
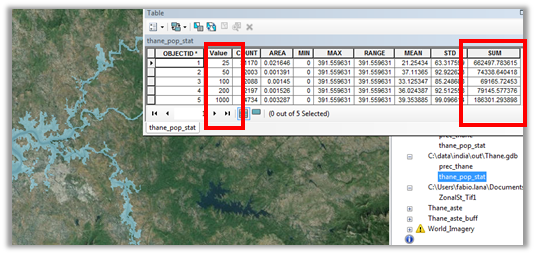
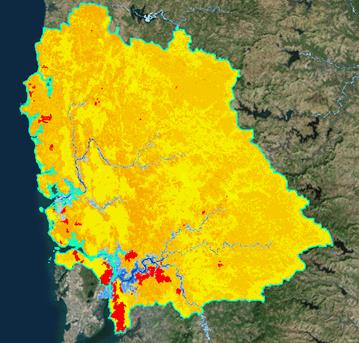
Application of methodology to the Thane District (India)
Thane District is a district in northern Maharashtra state in western
India. At the 2011 Census it was the most populated district in the nation,
with 11,060,148 inhabitants; however, in 2014 the district was split into
two with the creation of a new Palghar district, leaving the reduced Thane
district with a 2011 Census population of 8,070,032.
The headquarters of the district is the city of Thane. Other major
cities in the district are Kalyan-Dombivali, Mira-Bhayander, Bhiwandi,
Ulhasnagar, Ambarnath, Kulgaon-Badlapur, Shahapur and Navi Mumbai. This is the
third-most industrialised district in Maharashtra.
Thane is a city in Maharashtra, India, at the head of the Thane Creek. Thane covers an area of
147 km2 and has a population of more than 1.8 million within its municipal
limits, according to the 2011 census.
| RP | Pop | Cumulated Pop | % Pop |
|---|---|---|---|
| 25 | 67438 | 67438 | 0.61% |
| 50 | 49669 | 117107 | 1.06% |
| 100 | 1305300 | 1422407 | 12.86% |
| 200 | 2036170 | 3458577 | 31.27% |
| 500 | 176732 | 3635309 | 32.87% |
| 1000 | 57327 | 3692636 | 33.39% |
The first comparison between actual flood events and predicted values seems to be encouraging but more events must be controlled in order to establish a confidence factor for the system.The following images compares the calculation of SPARC with the flood event registered in Malawi in January 2015. After applying the Food Consumption Score, although not contextual layers which must still to be integrated into the calculations, the number of people deemed likely to need food assistance where almost 850,000 for the 4% probability and a little more of one million for the 0,01% probability versus 616,000 people estimated by in situ experts.