GRRASP
Geospatial Risk and Resilience Assessment Platform - Joint Research Center
The Geospatial Risk and Resilience Assessment Platform uses geo-spatial technologies for the analysis of the data and the visualization of the output obtained from spatial analysis. The system can be deployed in various servers in different EU Member States each one performing different tasks or accommodate different data.
Introduction
The GIS Platform is focused on European Critical Infrastructures (ECI) hence infrastructures which are of the highest importance for the Community and which if disrupted or destroyed would affect two or more MS, or a single Member State if the critical infrastructure is located in another Member State. This includes transboundary effects resulting from interdependencies between interconnected infrastructures across various sectors. The procedure for the identification and designation of European Critical Infrastructures (ECI), and a has a common approach to the assessment of the needs to improve the protection of such infrastructures will be established by means of a Directive. In any case models developed within the GIS Platform for ECI can transparently be reused for managing National Critical Infrastructures (NCI) whose management falls on the NCI owners/operators and on the Member States.
Following one of the key principles of the EPCIP the infrastructures the approach for selecting the
infrastructures is sector-by-sector based because it would be impossible the collect in one singular place
all the necessary experience, expertise and requirements of any sector involved in critical infrastructure
protections.
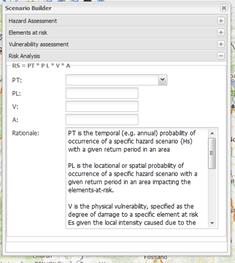
Vulnerability Assessment Vulnerability can be expressed in many different manners but
in the realm of spatial analysis, vulnerability is the result of the overlay between the two previous
elements, hazard and elements at risk.
Here we want to estimate only physical vulnerability and no calculations are executed to assess social,
economic or environmental vulnerability. Physical vulnerability measures the potential losses to a given element as a
result from the occurrence of a natural phenomenon of a given magnitude and expressed on a scale from 0 (no
damage) to 1 (total damage). The vulnerability assessment is carried out for infrastructures looking
for tangible losses. The basic method used is the application of damage-state curves, also called loss
functions or vulnerability curves (Smith, 1994). The inventory of infrastructures containing
information of the construction technologies and value of each infrastructure is used in combination with
various hazard maps for different return periods to generate vulnerability maps for a specific area.
Because
the GIS Platform is intended as a tool that can support experts in planning risk mitigation policies we
favor methods that use indicators for vulnerability and are based on expert opinion. The methodology
is still under development but is based on the approaches that can be found in the definition within the
disaster risk framework by Davidson (1997), the triangle of risk of Villagrán de Lèon (2004) and the UN/ISDR
framework for risk reduction (2004). This school of thinking defines vulnerability as a component within the
contest of hazard and risk. This school usually views vulnerability, coping capacity and exposure as
separate features (Birkmann, 2006).
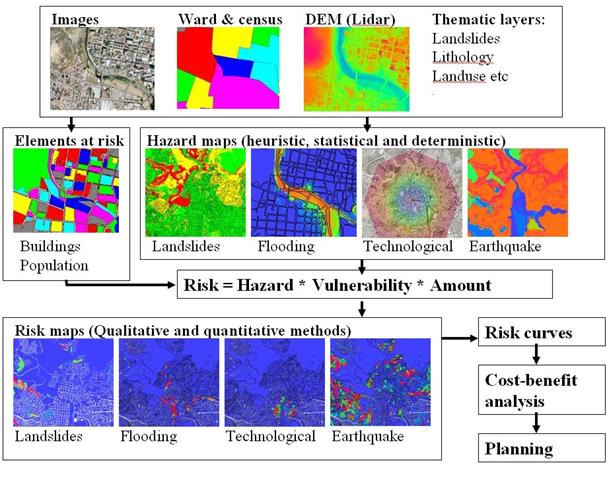
Multi-hazard risk assessment
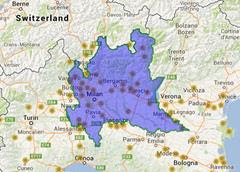
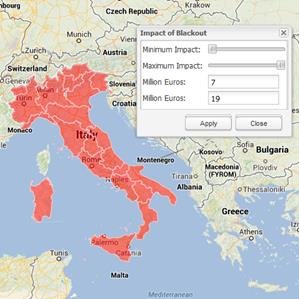
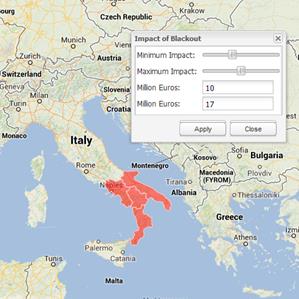
Once the hazard maps have been calculated and the vulnerability of critical infrastructures under scrutiny has been individuated is possible to perform a risk analysis for multiple or single hazards (Figure 27 - Cees Van Westen - Faculty of Geo-Information Science and Earth Observation – University of Twente – The Netherlands) With spatially enabled risk analysis is possible to achieve a fairly accurate estimation and quantification of the probability of losses (absolute risk) as well as qualitative risk assessment where each feature is categorized into a low, moderate or high level of risk. The system has a tool to allow users to filter the data calculated in the process of building scenarios using maximum and minimum thresholds of monetary damage.In Figure 28 is possible to gauge the impact of the blackout that hit Italy in 2003. Applying a lower and upper threshold with damage values of 10 and 17 million Euros the tool displays only the southern regions, as were those with a known time of hospitalization increased and consequently a greater economic damage.
|
|

Geographic data available in the platform can be broadly divided into two categories: Static spatial data stored locally (e.g. same server hosting the platform)· Static spatial data stored remotely(e.g. a different server from the one hosting the platform) and dynamic real time data (e.g. the data are provided by remote servers often but not always storing their geographical position) The two type share many similarities but have a different degree of usability. The locally stored data can be viewed, selected and edited (e.g. add new data or delete old ones) whilst the remotely stored data are subjected to the restrictions put in places by the data owner and administrators and are usable for visualization purposes, are in some cases selectable but cannot be edited. Dynamic data are also not changeable and can have an even more strict usability policies and due to their special nature are in some cases are not spatially located and are presented as a list of events (see Figure 7). They represent threats posed to the critical infrastructure such as earthquakes, flooded areas, adverse weather conditions, etc...

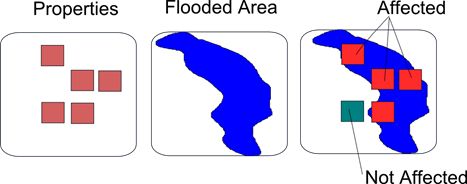
In case of a catastrophic event is very unlikely that an entire network is affected,
especially for networks that spans over an entire continent like Europe. More likely, due to the characteristic
of both the event and the network, the effects will influence the elements of the network in the vicinity of the
catastrophic event and will diminish with the increase of the distance from the event.
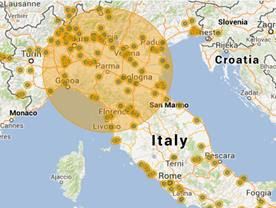
In some cases is
possible to evaluate this extent of effects automatically (using mathematical models) but in some other cases it
can be more feasible to ask an expert judgment for a delineation of the likely area of impact.
For this
reason the GIS Platform has some methods for selecting data manually.
Scenario Builder
The Scenario Builder guides the user step by step in the creation of a procedure that uses the
procedure known as SMCE (Spatial Multiple Criteria Evaluation) which is an implementation of the
Multi-Criteria Analysis (MCA) but with a substantial use of data and indicators spatially located.
In the evaluation field, multi-criteria analysis is usually an ex ante evaluation tool, and is particularly
used for the examination of the intervention’s strategic choices.
Is a decision-making tool developed for assessing the risk to which a critical
infrastructure is exposed related to a specific hazard in situations where multiple criteria are involved
and confusion can arise if a logical, well-structured decision-making process is not followed.
This
tool tries to answer questions like “What percentage of the sewer network will be affected in case of
earthquake with a return period of one hundred years within a radius of 25 km?”.