CHIRPS precipitation data and NOAA temperature data for the Horn Of Africa
Xarray introduces labels in the form of dimensions, coordinates and attributes on top of raw NumPy-like multidimensional arrays, which allows for a more intuitive, more concise, and less error-prone developer experience. Multi-dimensional (a.k.a. N-dimensional, ND) arrays (sometimes called “tensors”) are an essential part of computational science. They are encountered in a wide range of fields, including physics, astronomy, geoscience, bioinformatics, engineering, finance, and deep learning. In Python, NumPy provides the fundamental data structure and API for working with raw ND arrays. However, real-world datasets are usually more than just raw numbers; they have labels which encode information about how the array values map to locations in space, time, etc.
xclim is a library of functions to compute climate indices from observations or model simulations. It is built using xarray and can benefit from the parallelization handling provided by dask. Its objective is to make it as simple as possible for users to compute indices from large climate datasets and for scientists to write new indices with very little boilerplate.
CHIRPS and NOAA Data
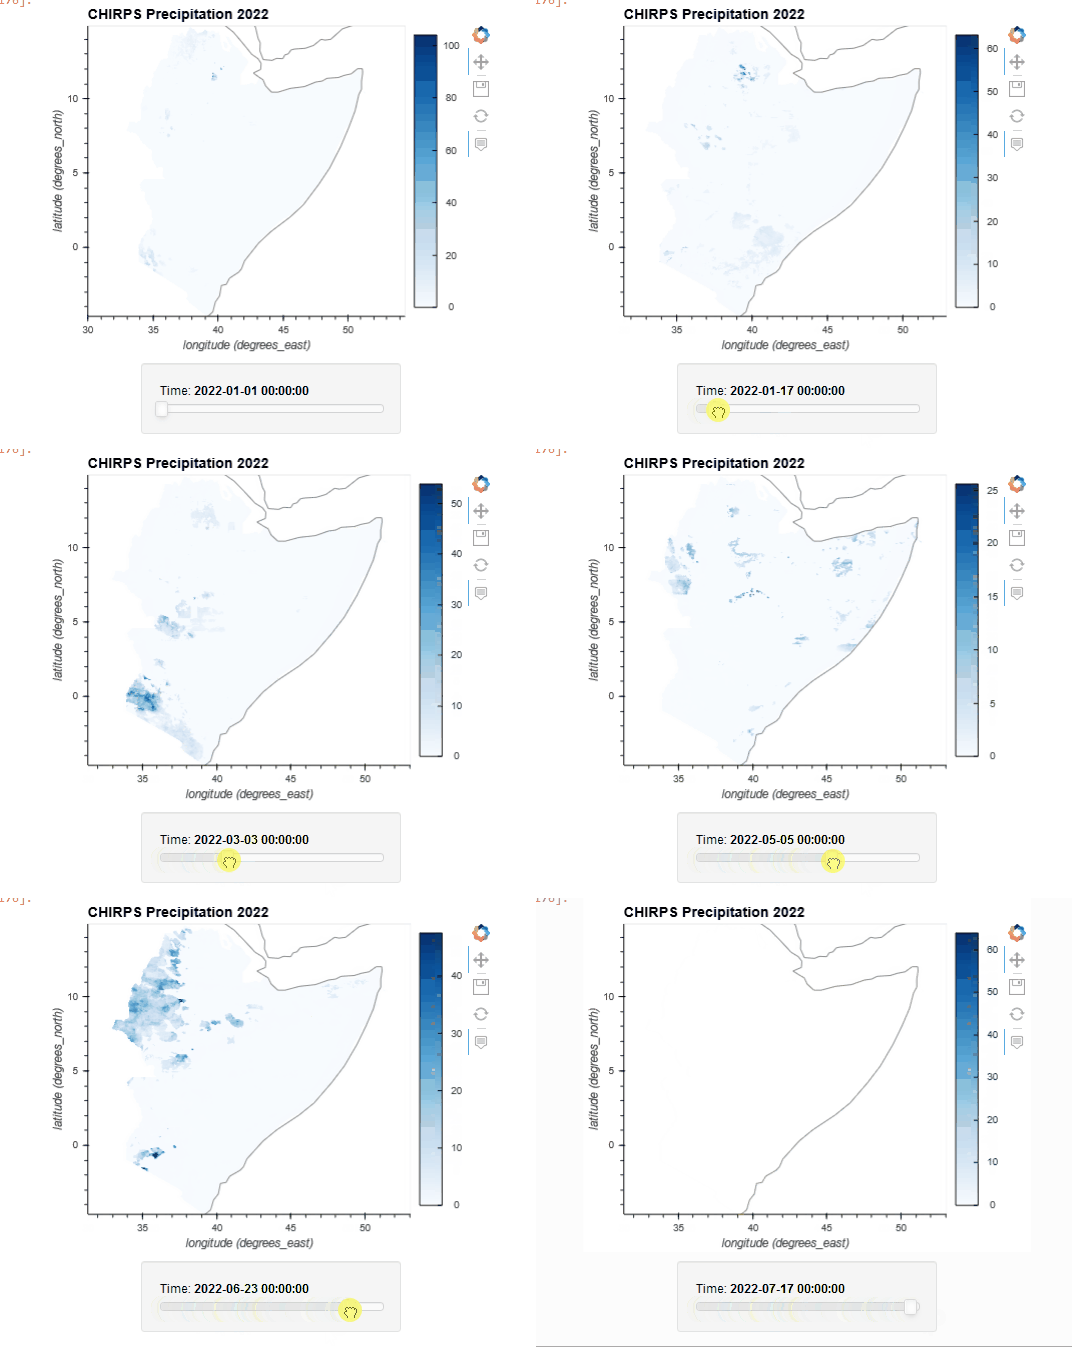
Rainfall Estimates from Rain Gauge and Satellite Observations
Since 1999, USGS and CHC scientists—supported by funding from USAID, NASA, and NOAA—have developed techniques for producing rainfall maps, especially in areas where surface data is sparse. Estimating rainfall variations in space and time is a key aspect of drought early warning and environmental monitoring. An evolving drier-than-normal season must be placed in a historical context so that the severity of rainfall deficits can be quickly evaluated. However, estimates derived from satellite data provide areal averages that suffer from biases due to complex terrain, which often underestimate the intensity of extreme precipitation events. Conversely, precipitation grids produced from station data suffer in more rural regions where there are less rain-gauge stations. CHIRPS was created in collaboration with scientists at the USGS Earth Resources Observation and Science (EROS) Center in order to deliver complete, reliable, up-to-date data sets for a number of early warning objectives, like trend analysis and seasonal drought monitoring.
Global Unified Temperature 0.5x0.5 Global Daily Gridded Temperature

The NOAA Physical Sciences Laboratory (PSL) conducts weather, climate and hydrologic research to advance the prediction of water availability1 and extremes. This data set is used for verification by NOAA/CPC. The data is global GTS data and is gridded using the Shepard Algorithm. The values are the max/min for 6Z-6Z.
Climate indicators
xclim.core.indicator.Indicator instances essentially perform the same computations as the functions found in the xclim.indices library, but also run a number of health checks on input data and assign attributes to the output arrays. So for example, if there are missing values in a time series, indices won’t notice, but indicators will return NaNs for periods with missing values (depending on the missing values algorithm selected, see Missing values identification). Indicators also check that the input data has the expected frequency (e.g. daily) and that it is indeed the expected variable (e.g. a precipitation flux). The output is assigned attributes that conform as much as possible with the CF-Convention. Indicators are split into realms (atmos, land, seaIce), according to the variables they operate on.
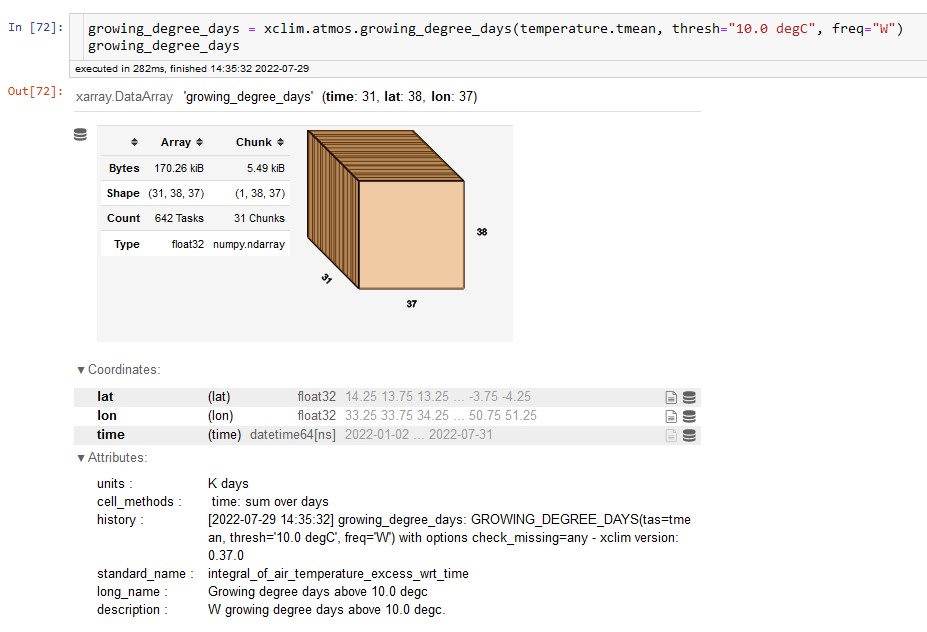
Growing Degree Days (GDD)
For most plants, phenological development is strongly related to the accumulation of heat or temperature units above a threshold or base temperature below which little growth occurs. This lower threshold temperature varies with plant species. Scientists have determined the lower base temperature for corn is 50 °F (10 °C). In some plants there is also an upper threshold temperature, above which conditions are stressful to the plants. The upper limit for corn is 86 °F (30 °C). Although temperature is the most important factor controlling the rate of plant development, other factors such as water and light availability and daylight length may modify its effects. The most common temperature index used to estimate plant development is growing degree days (GDD) which are calculated from the daily maximum and minimum air temperature. Growing degree days have proven useful for crop consultants, producers, and scientists who use them to predict plant development rate and growth stage. In certain crops this information is used to help plan crop management decisions such as irrigation or pesticide application timing, and for scheduling harvest.


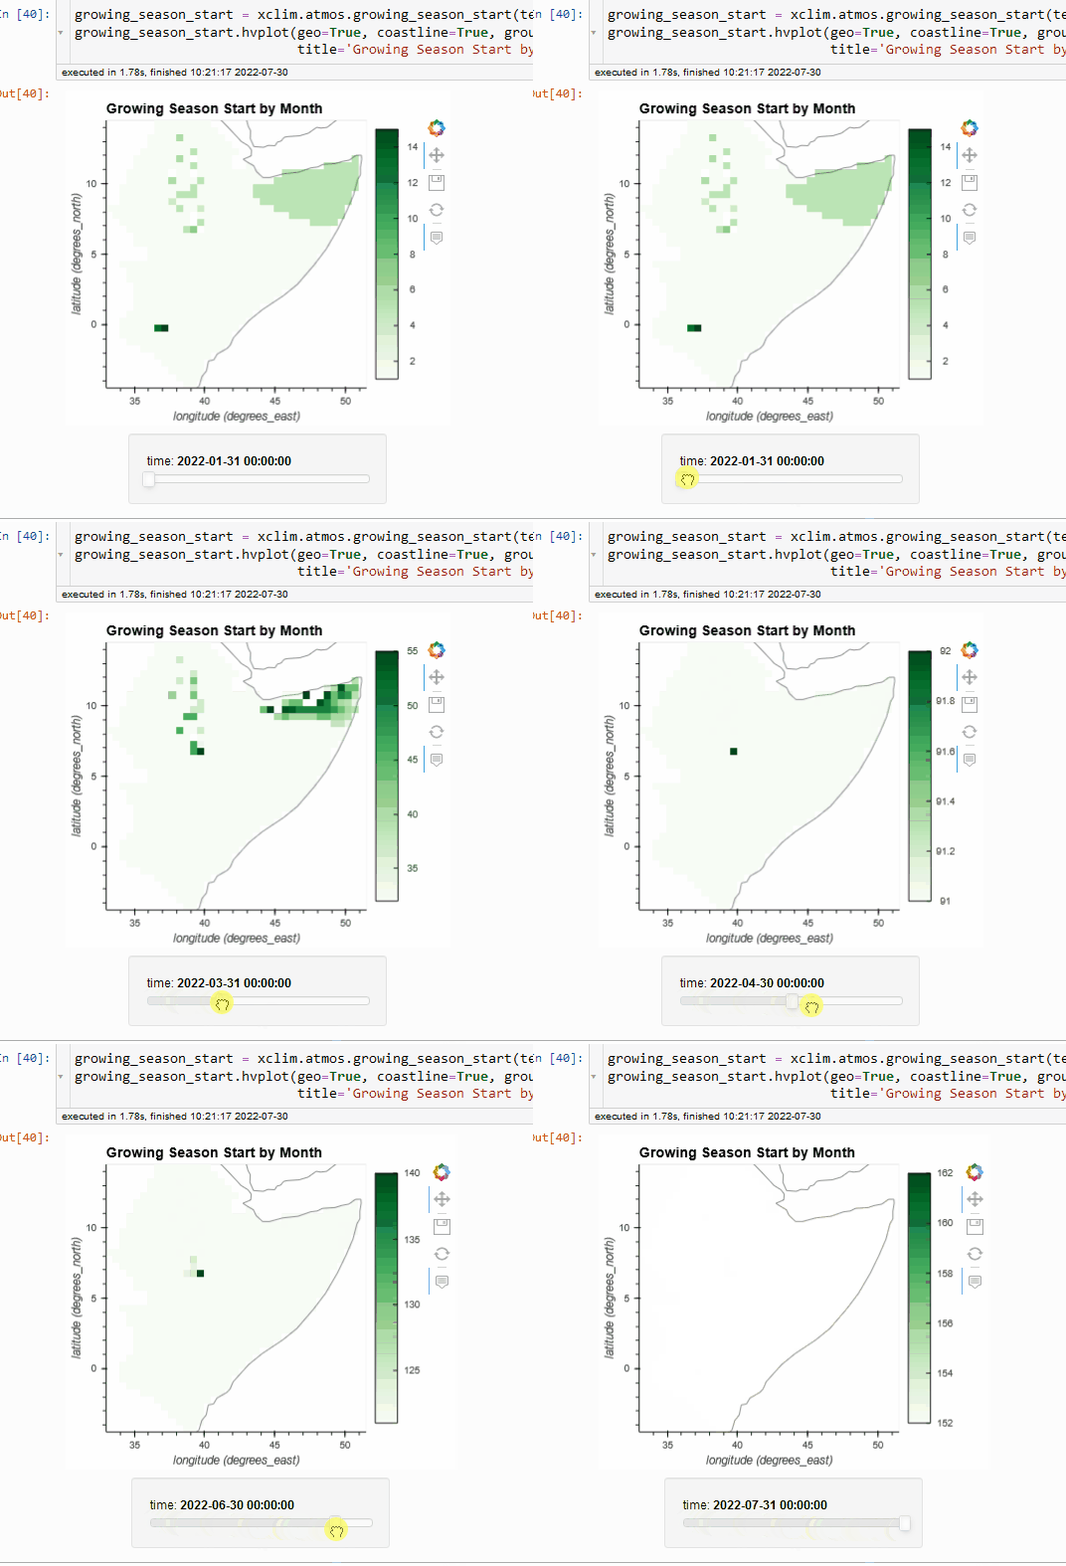
Growing Season - Start,end and length
growing_season_start: Day of the year of the start of a sequence of days with mean temperatures consistently
above or equal to a threshold, after a period with mean temperatures consistently above the same threshold.
growing_season_end: Day of the year of the start of a sequence of days with mean temperatures consistently
growing_season_length: The number of days between the first occurrence of at least six consecutive days with mean daily
temperature over a threshold (default: 5℃) and the first occurrence of at least six consecutive days with mean daily
temperature below the same threshold after a certain date. (Usually July 1st in the northern emisphere and January
1st in the southern hemisphere.)
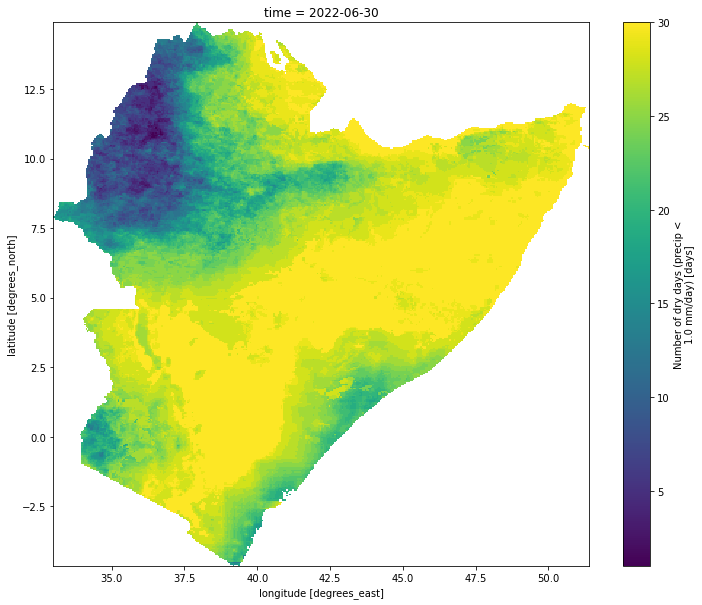
Measuring dryness
maximum_consecutive_dry_days: Return the maximum number of consecutive days within the period where
precipitation is below a certain threshold.
dry_days: The number of days with daily precipitation below threshold.
