Dynamic Calculation of Aridity Index using MODIS,CHIRPS and Google Earth Engine
Preliminary
Plant Village
Google Earth Engine Aridity Index App
Over the last decades, there has been a growing interest in evaluating the predicted potential impacts of future climatic conditions on ecosystem functioning. Ecological indicators developed to assess ecosystem functioning strongly rely on soil and vegetation variables.
The strong negative relationships observed between aridity and stability, nutrient cycling indices
demonstrated that increasing aridity can reinforce erosive processes and deteriorate nutrient
cycling (i.e. aridity decreased soil carbon, nitrogen and enzymatic activities).
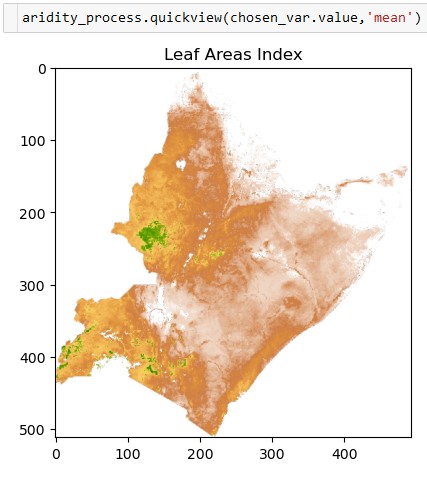
Similarly, aridity was negatively related to vegetation structural attributes including patch cover and
landscape organization index. This finding suggests that any increase in aridity can promote the
loss of perennial vegetation cover.
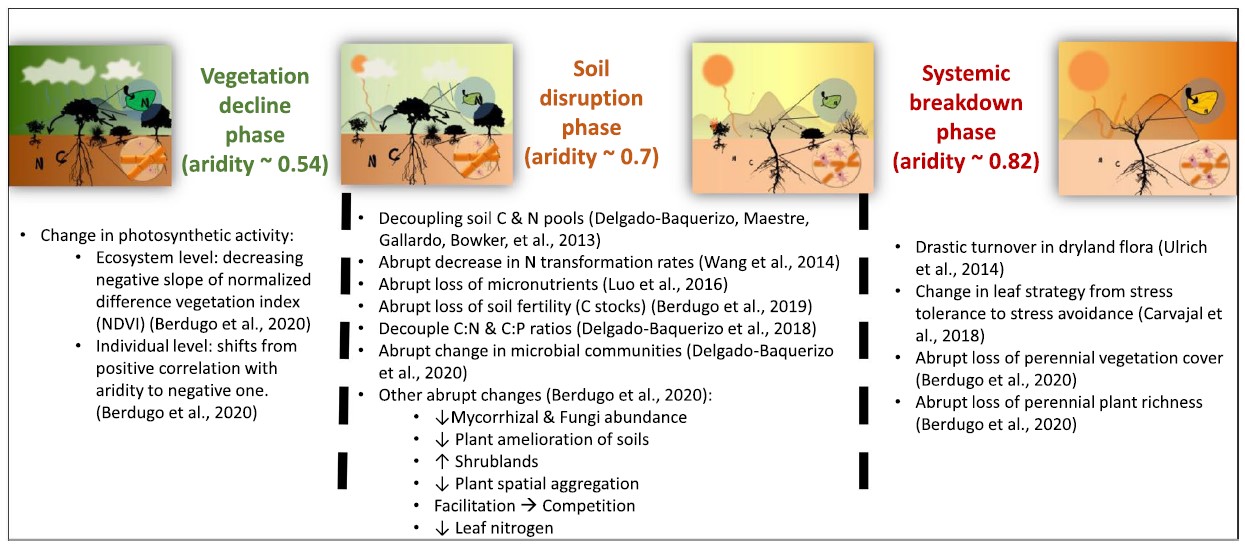
With ongoing climate change, the probability of crossing environmental thresholds
promoting abrupt changes in ecosystem structure and functioning is higher
than ever. In drylands (areas where it rains <65% of what could be potentially
evaporated), recent research has shown how the crossing of three aridity thresholds
[at aridity (1-Aridity Index) values of 0.54, 0.70 and 0.80] leads to abrupt
changes on ecosystem structural and functional attributes. Despite the importance
of these findings and their implications to develop effective monitoring and
adaptation actions to combat climate change and desertification, we lack a proper
understanding of the mechanisms unleashing these abrupt shifts.
Concurring evidence from independent studies highlights the existence of systemic (i.e. attaining
several ecosystem compartments), sequential (as aridity increases) and global ecosystem thresholds
associated with increases in aridity across drylands world-wide.
According to aridity forecasts, up to 22% of emerged lands may cross one or several of these aridity
thresholds by the end of this century.
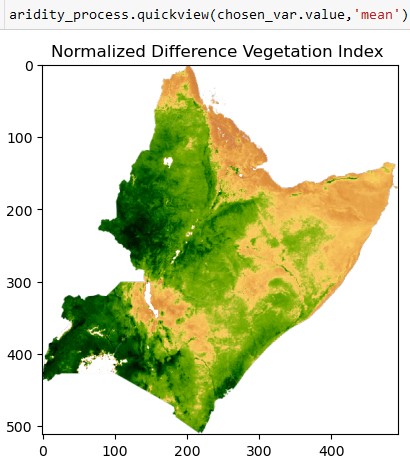
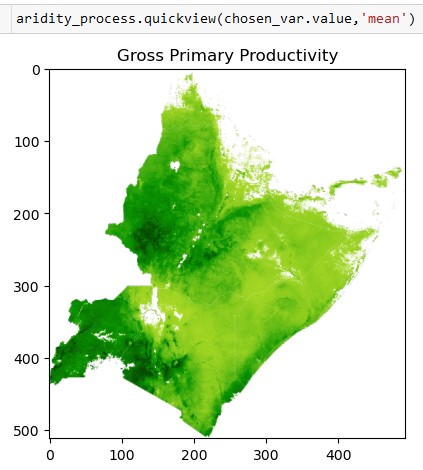
These changes initialize with a nonlinear decrease in photosynthetic activity at aridity values of
0.54, followed by different and abrupt changes in the soil system and abrupt increases in shrublands
at aridity 0.7. Finally, an abrupt decline in plant cover matches abrupt declines in richness and
changes in leaf strategies to stress avoidant aridity values of 0.82.
Aridity thresholds spotted generally match previous divisions of drylands separating dry–subhumid
from semi-arid (aridity ~0.5) and semi-arid from arid (aridity ~0.8). Indeed, soil disruption phase
matches with the idea that transitioning from semi-arid to arid systems involves a lack of suitable
soil fertility to perform agriculture.
Similarly, the definition of semi-arid areas as those in which
vegetation indices are linearly correlated with aridity coincides with the vegetation decline phase.
What aridity thresholds add to previous classification frameworks is matching the exact value of
aridity with key ecosystem attributes that are affected by aridity in abrupt manners. This provides
us the pieces of a puzzle to be assembled through mechanistic knowledge to understand abrupt
changes in drylands.
The basic idea is to generate aridity maps capable of highlighting the areas in which the conditions
are created for long-lasting changes to the vegetation, to the soil and more generally a systemic
failure that leads to the loss of perennial vegetation
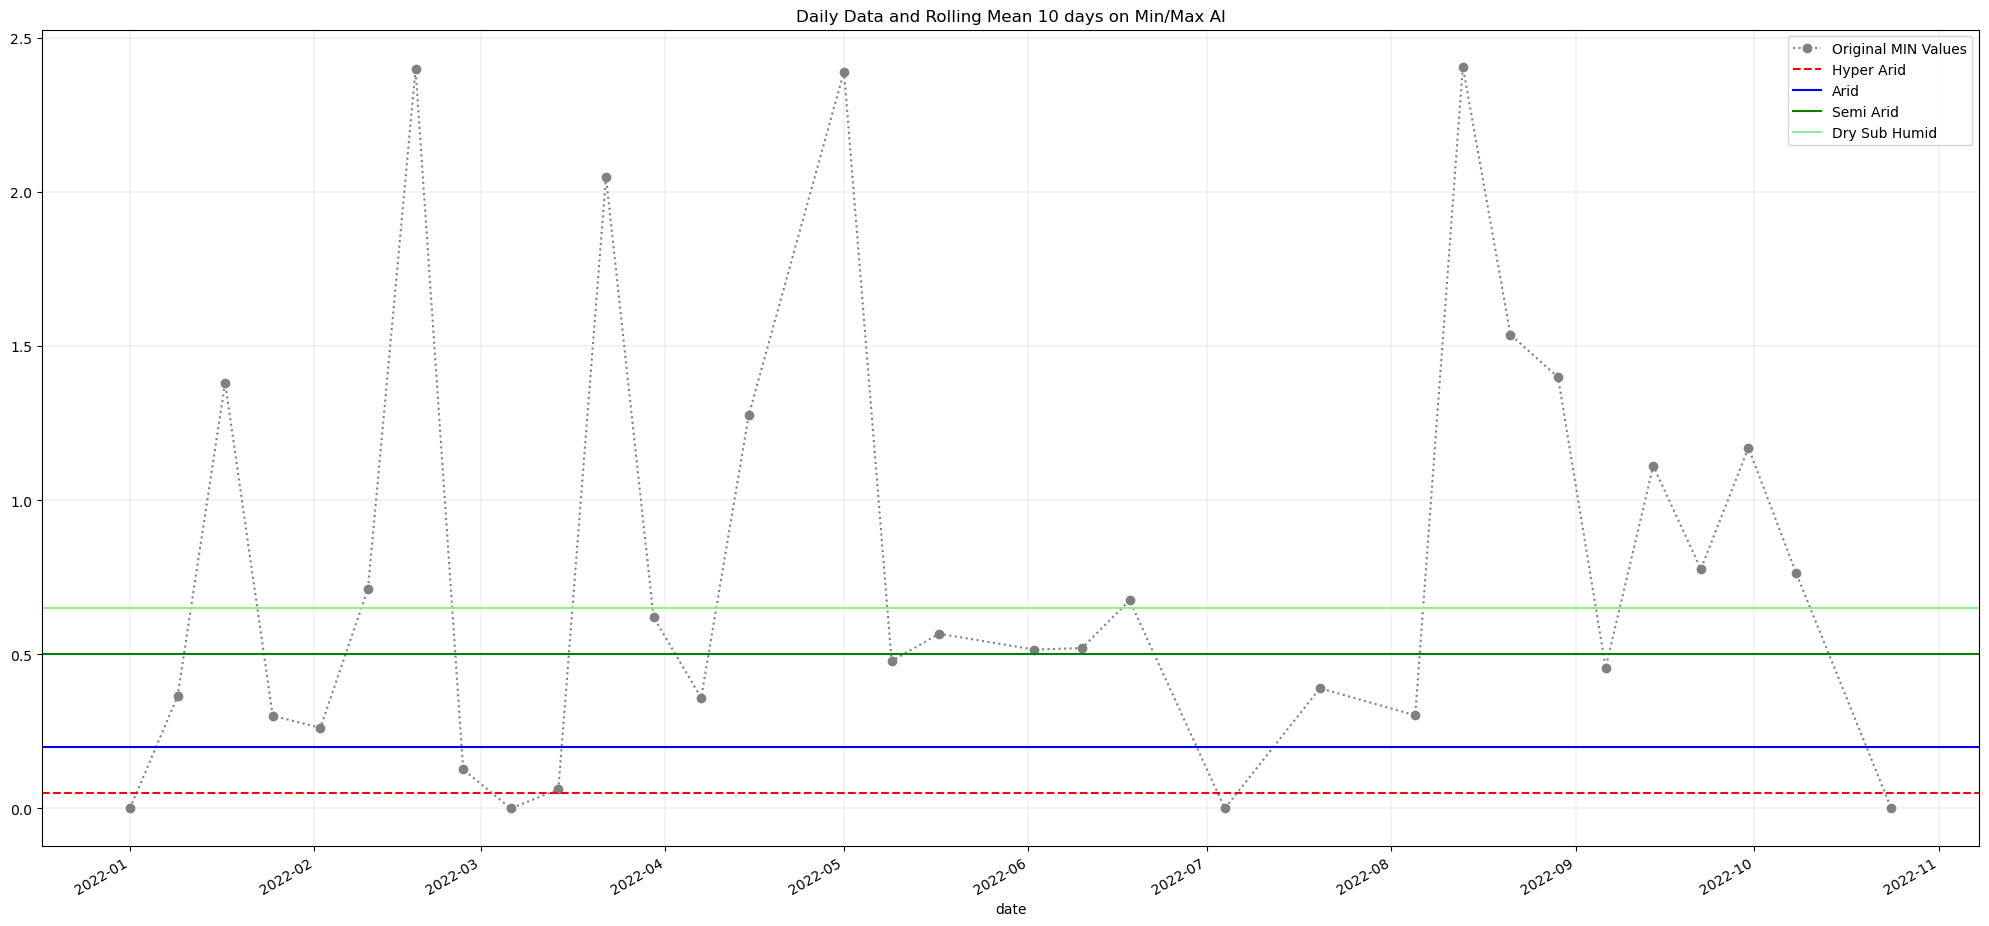
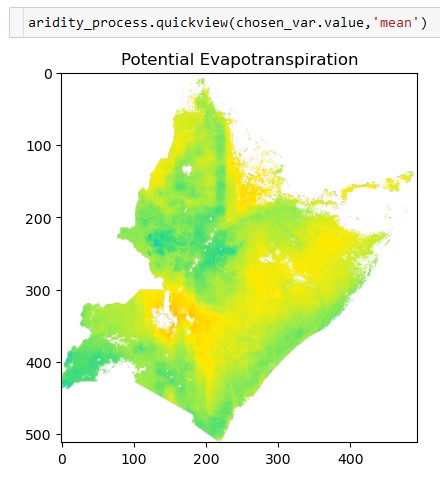
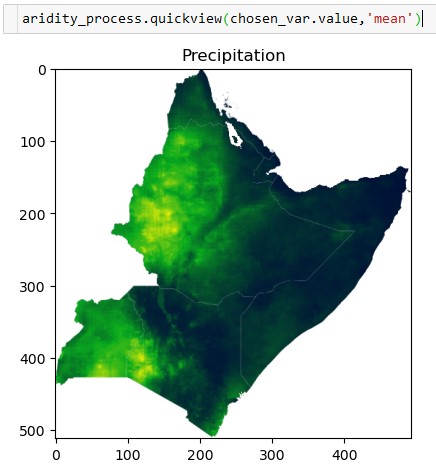
The Aridity Index (AI) is a simple but convenient numerical indicator of aridity based on long-term
climatic water deficits and is calculated as the ratio P/PET. The AI is a widely used measure of
dryness of the climate at a given location.
The basic idea is to generate aridity maps capable of highlighting the areas in which the conditions
are created for long-lasting changes to the vegetation, to the soil and more generally a systemic
failure that leads to the loss of perennial vegetation
The Aridity Index (AI) is a simple but convenient numerical indicator of aridity based on long-term
climatic water deficits and is calculated as the ratio P/PET. The AI is a widely used measure of
dryness of the climate at a given location.
This calculation uses the MODIS PET data generated every 8 days, and the daily CHIRPS precipitation
data which is also aggregated as an 8-day sum. Both datasets are stored in Google Earth Engine and
are queried, managed and analyzed using the Python API.
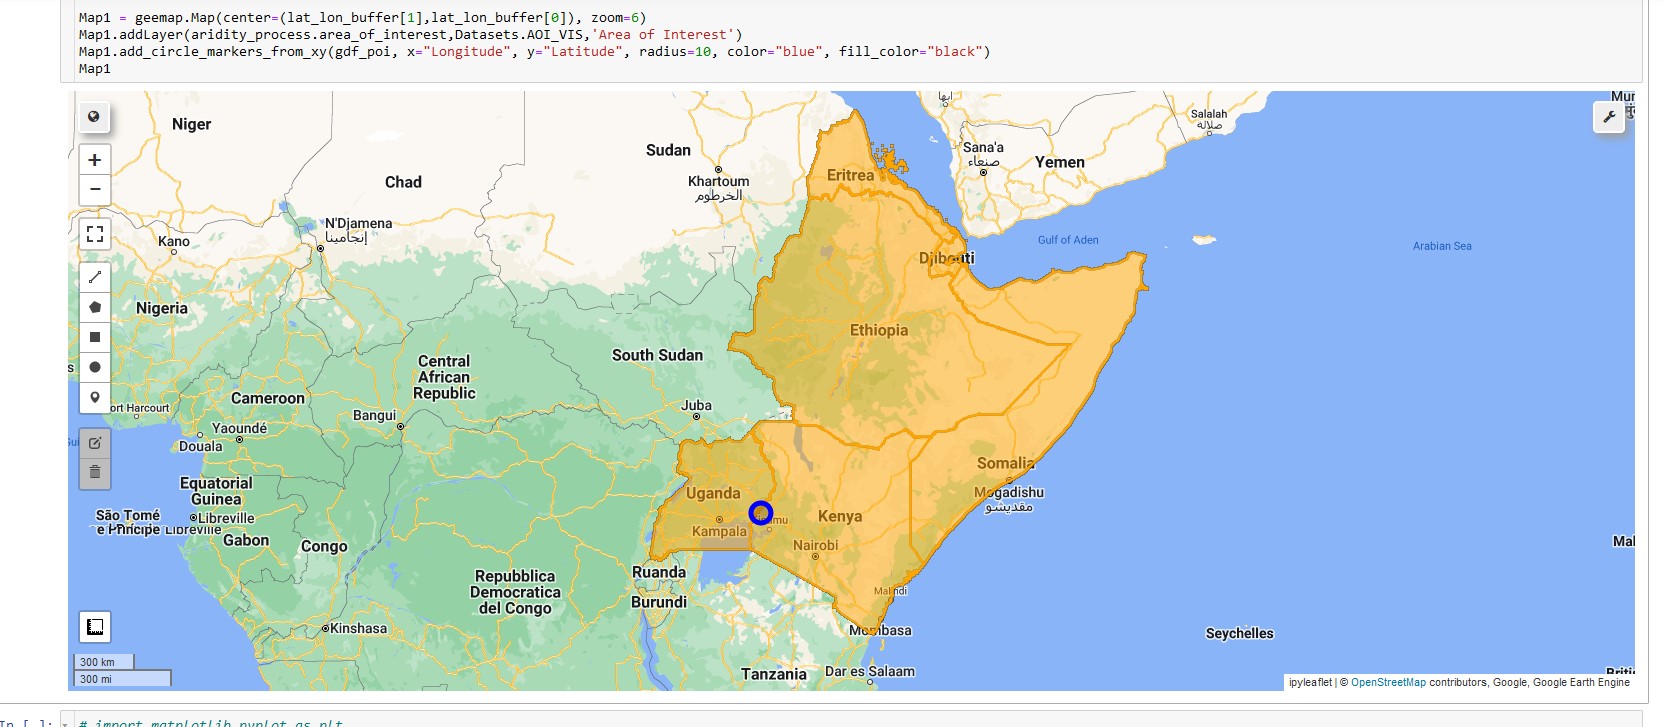 The visualization of the python code is carried out using a Jupyter Notebook, which using geemap
makes it easy to check the analyses precisely and in real time.
The visualization of the python code is carried out using a Jupyter Notebook, which using geemap
makes it easy to check the analyses precisely and in real time.
The check of the generated aridity index is done through a comparison with the dataset generated by
CGIAR which offers on a monthly basis high-resolution (30 arc-seconds) global raster climate data
for the 1970-2000 period, related to evapotranspiration processes and rainfall deficit for potential
vegetative growth, based on the implementation of a Penman-Montieth Reference Evapotranspiration
(ET0) equation.