Cities are now home to the majority of the world’s population, and are drivers of economic growth,
wealth creation, social interaction and well-being. They also present huge inequalities in health,
affluence, education and lifestyle with persistent challenges for management, administration and policy.
For example, alongside an existing global market of £400 billion for smart city technology, the UN estimates
that $350 trillion or five times global GDP needs to be spent on urban infrastructure to address urgent needs.
Urban analytics draws from data which are captured by governments, businesses and other intermediaries.
Conventional mechanisms such as censuses and surveys are complemented by devices which are increasingly
ubiquitous. In addition to government and public planning, analytics are is relevant to organisations
across sectors including retail, financial services, mobility, health, policing, and utilities.
The diversity in content and approaches gives rise to productive overlaps with many other Turing programmes and challenges.
15-Minute City Planning

A planning framework and model based on an ideal geography where "human needs and desires" are
accessible in a "15 minute" walk, bike ride, or transit trip.
The idea, which was originally conceived by cities expert and Paris 1 Pantheon-Sorbonne University
professor, Carlos Moreno, was not expressly borne out of the pandemic but it has given it a second wind.
In fact, it may yet reach new heights of popularity thanks to the enthusiastic endorsement of Paris
mayor and newly-minted presidential candidate, Anne Hidalgo, who made the "15-minute city" the
centrepiece of her successful mayoral re-election campaign last year.
The 15-minute city planning framework aggregates many of the city's past and current goals such as
climate action, equitable land use policies, and healthy neighborhoods for all into a comprehensive
and understandable strategy to provide quality neighborhoods.
"The 15-minute framework" refers to the overall concept and goal of building a 15-minute city &
creating 15-minute neighborhoods, and is a general approach we can use to make decisions on land use
policy, funding requests from developers and organizations, and other choices related to city action
and investment.

Measuring Urban Heat Islands and Vulnerability Indices
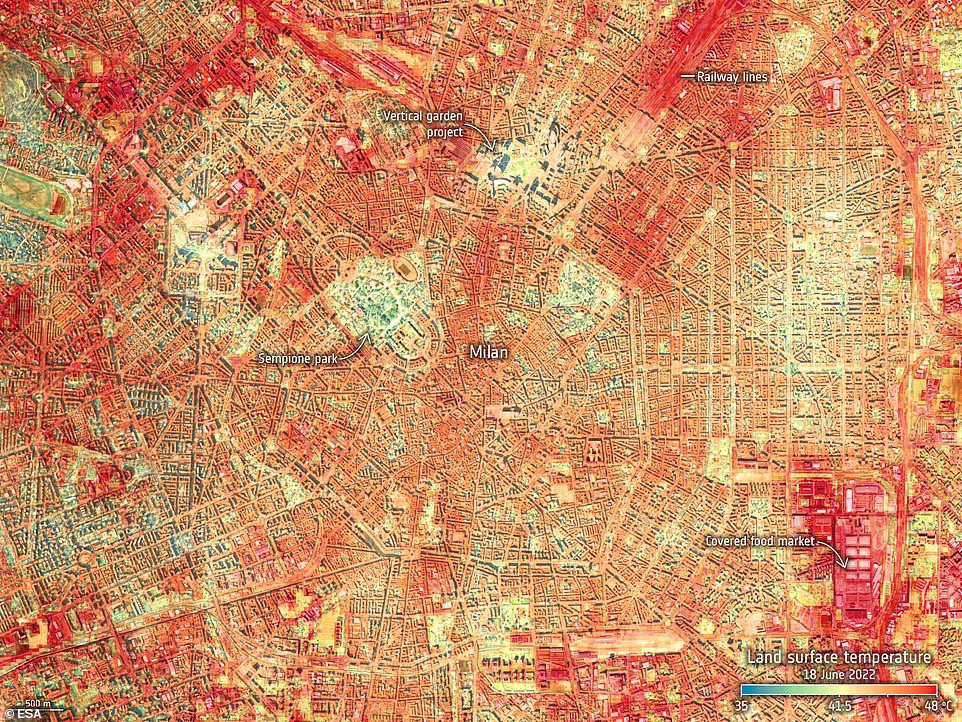
Structures such as buildings, roads, and other infrastructure absorb and re-emit the sun’s heat more
than natural landscapes such as forests and water bodies. Urban areas, where these structures are highly
concentrated and greenery is limited, become “islands” of higher temperatures relative to outlying
areas.
These pockets of heat are referred to as “heat islands.”
The rapid growth of urban populations, the
urban heat island effect, and increase in the frequency and duration of heat waves due to climate change,
raise a series of issues about the increased health risks of sensitive urban populations to extreme
heat and the effective means of mitigating the impacts of heat waves.
Remote sensing provides global, timely, objective observations to monitor the effects of urban heat
islands (UHI) over time. Thermal mapping from satellites can be used to monitor land surface temperature
(LST), while optical data collected from satellites can inform where and when land use and land cover
have changed over time and can be used to approximate air temperatures.
Once UHIs have been mapped, incorporating socioeconomic data pertaining to population, demographics,
and health information into
heat vulnerability indices (HVI) can help guide interventions to manage heat related risks to public
health.