How climate change will drive risk of:
- Cyclones: Under 2.5°C of global warming, the most devastating storms are projected to occur up to twice as often as today. (Bacmeister et al., 2018)
- Drought: The number of people suffering extreme droughts across the world could double in less than 80 years (Pokhrel, 2021).
- Floods: For each 1°C of global warming, extreme daily precipitation events may intensify by about 7% (IPCC, 2021).
- Heatwave: Heat stress from extreme heat and humidity could annually affect 1.2 billion people by 2100 (Li, Yuan & Kopp, 2020).
- Infectious diseases: By 2050, mosquitoes that carry vector-borne diseases like Malaria could reach an estimated 500 million more people (Ryan et al., 2019).
- Sea level rise: Coastal flooding events could threaten assets worth up to 20% of the global GDP by 2100 (Kirezci et al., 2020).
- Wildfire: By 2030, fire season could be three months longer in areas already exposed to wildfires (Ross, Gannon & Steinberg, 2020).
Design for Resilience
Design for Resilience is about creating restorative design that addresses humanity's most critical issue: climate change. DESIGN for RESILIENCE is interested in designs and design methods the approach of foreseeing the future, long-term, sustainable, being able to synthesize technological developments with inspiration and aesthetics. Resilience means the capacity to recover quickly from difficulties with the ability of adaptation. Resilient design and resilient city are deal with better living. Natural disasters are becoming more frequent and intense across the globe. Enhancing resilience to increasing hazards, exposure, and vulnerability therefore requires leveraging of advanced geospatial technologies for better disaster mitigation and management. With continuous improvements in satellite data sensor acquisition parameters together with geo-computational approaches, geospatial technologies have emerged as the most powerful technology for all phases of disaster management.
Geospatial analysis and disaster risk reduction
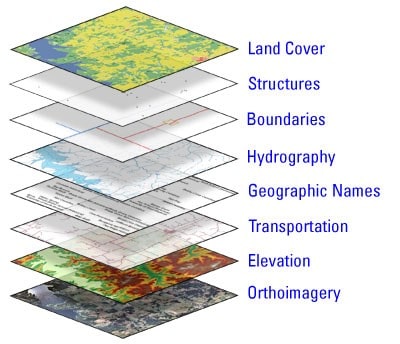
Geospatial data analysis involves collecting, combining, and visualizing various types of geospatial data.
It is used to model and represent how people, objects, and phenomena interact within space, as well as to make
predictions based on trends in the relationships between places.
Put another way, geospatial data analytics puts data in a more accessible format by introducing elements of space
and time. Information that would be difficult to get out of reading line after line in a table or spreadsheet
becomes much easier to understand in the context of a visual representation of what the world really looks like.
This allows people to more easily pick up on patterns such as distance, proximity, density of a variable,
changes over time, and other relationships.
In short, geospatial data analysis is about going beyond determining what happens to not only where and
when it happens, but also why it happens at a specific place and/or time.
Geospatial big data analytics makes trends regarding space and time more visually obvious than they would be in
a massive set of raw data. This, in turn, offers many advantages over analyzing datasets without this type
of context.
To illustrate, here are 4 benefits of using geospatial data in analytics:
- Identifying spatial patterns and trends – Some relationships and connections cannot be understood without factoring in “where” (or “when”) they are occurring.
- More opportunities for segmentation – When location is added as a component of an analysis, you can begin to segment and filter based on geography, which makes your entire analysis more detailed.
- Modeling the real world – Everything has a geographical position, so analysis without location is already missing a key component. Geospatial data enables you to model the real world, often within real time.
- Accurate predictions lead to better decision-making – When you study a phenomenon over time in the context of a particular location, you begin to better understand why it happens where and when it does. This helps you better predict not only what will happen, but also when and where it will happen. Then you can plan out how you might react to (or even influence) future events.